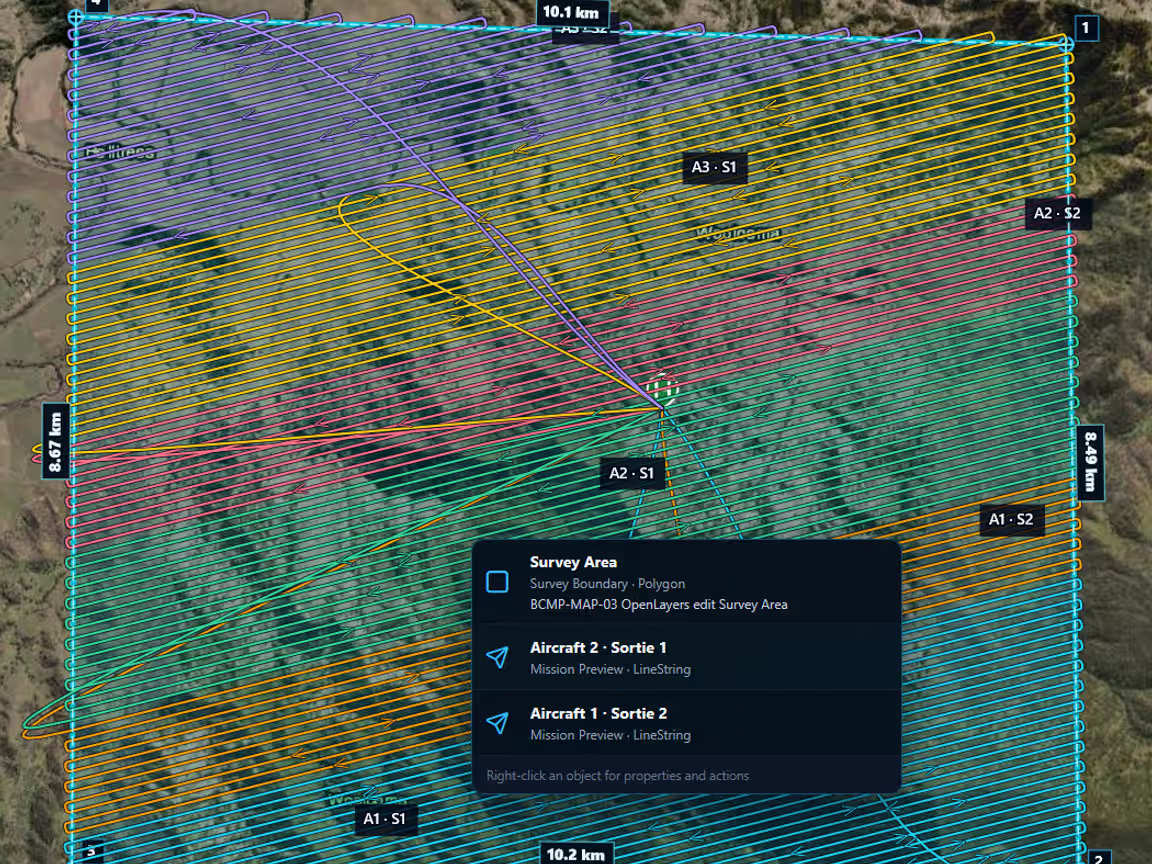
Ultra-High-Definition Magnetic Drone Survey
Magnetic drone survey and UAV magnetic survey services for mineral exploration teams that need aircraft-scale coverage with ultra-high-definition, terrain-following sensor control, clear acquisition QC and interpretation-ready magnetic data.

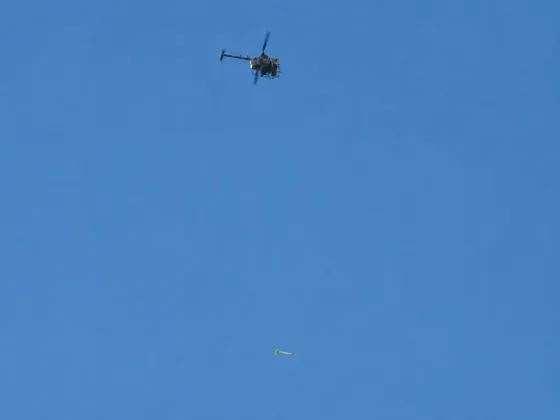
SENSOR-CENTRIC FULL-PHYSICS PLANNING
The World’s Most Accurate Drone Magnetic Survey System
We simulate the suspended magnetometer’s trajectory, including pendulum motion, cable dynamics and wind effects. The helicopter’s flight path is calculated to keep the sensor within our exceptionally narrow terrain-following corridor.
Explore the methodAircraft-scale coverage. Low-level magnetic detail.
The useful comparison starts with the deliverable. BlueCapHeli® carries the suspended magnetic sensor through a full survey week; one electric survey drone provides the smaller-aircraft reference; crewed helicopter coverage remains project-specific and depends on altitude, line spacing, sensor and approvals.
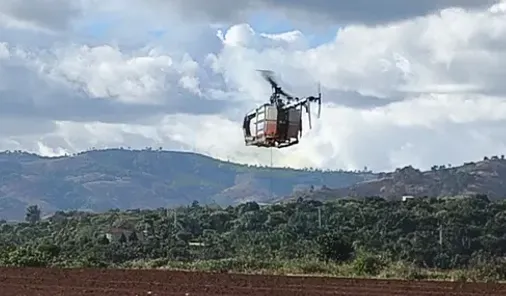
BlueCapHeli® survey system
10,500 line-km / week
M600-series multirotor & similar
600–1,250 line-km / week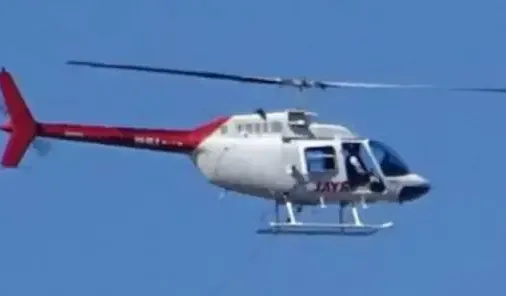
Crewed Bell 206 helicopter
≈2,700 line-km / week| Line spacing | Use | km² / day | km² / week |
|---|---|---|---|
| 25 m | Detailed targeting | ≈50 km² | ≈250 km² |
| 50 m | Standard exploration grid | ≈100 km² | ≈500 km² |
| 100 m | Regional reconnaissance | ≈200 km² | ≈1,000 km² |
10,500 line-km per mobilisation week · one BlueCapHeli® system
- km² / day
- ≈50 km²
- km² / week
- ≈250 km²
- km² / day
- ≈100 km²
- km² / week
- ≈500 km²
- km² / day
- ≈200 km²
- km² / week
- ≈1,000 km²
Project preparation
Office and regulatory preparation plus the pre-mobilisation workshop.
Field team & operations
Actual staff time for planning, field operations, QC and agreed project work.
Equipment deployment & wear
Planned aircraft, sensor and equipment deployment, usage and wear.
Mobilisation, logistics & materials
Travel, logistics and consumables or other agreed materials.
Drone survey cost calculator
Loading current Quote range…
Simulate the sensor path. Fly the calculated trajectory.
BlueCap’s 3D physical model plans the magnetometer’s height, left–right position and motion along each survey line. Terrain, cable response, along-line speed and settling are considered together to limit height- and motion-related variation in the magnetic record and preserve fine geological detail.
Above or below the planned sensor height over the terrain-following reference.
To either side of the planned survey line, measured at the magnetometer.
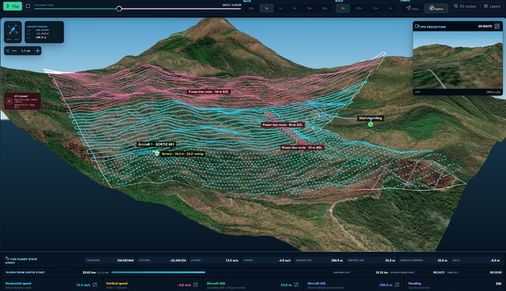
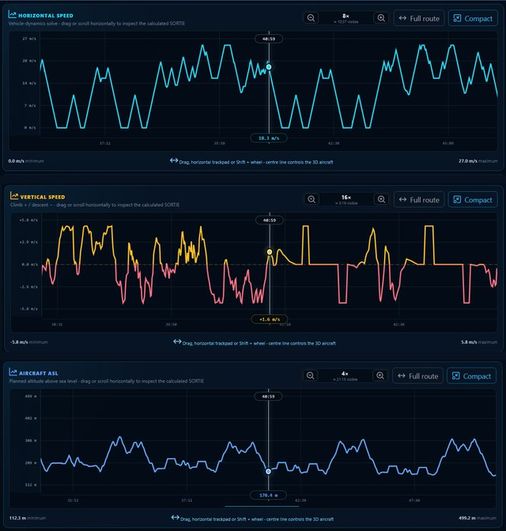
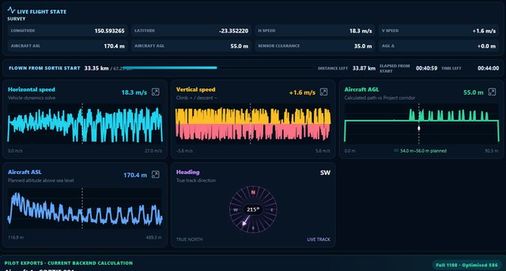
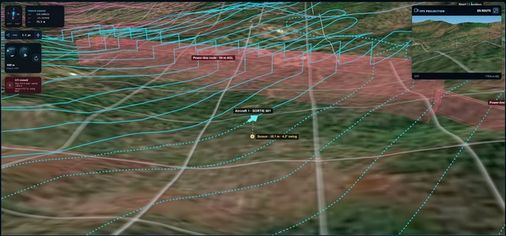
Sensor path over the terrain
Our sensor-centric full-physics simulation calculates the helicopter movement required for the planned magnetometer trajectory, including cable dynamics, pendulum motion, wind effects, turns and line-entry settling.
- Sensor AGL is evaluated at the sensor’s ground position, separately from aircraft altitude
- Cross-track position, terrain-draped speed and line-entry settling remain visible
- Field performance is checked against recorded flight data

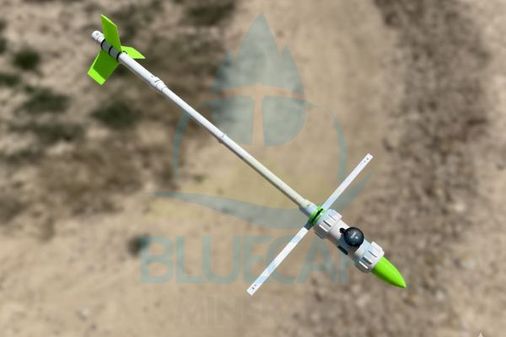

Magnetic cleanliness at the sensor
The suspended BlueCapBird® keeps the quantum sensor away from the carrier’s electronics, batteries and structures, while the field record retains the motion, position and height channels needed to understand the observation.
- Complete towed payload carries 12.2 g of metal
- Payload operates at least 20 m below the helicopter on the BlueCapWinch®
- QuSpin QTFM Gen 2 total-field measurement remains tied to the acquisition record


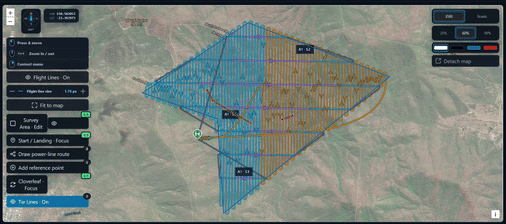
Calibration and crossover control
A project heading-calibration flight uses constant-elevation cloverleaf checks; zero-crossing calibration and perpendicular tie lines provide recorded controls for QC and agreed levelling.
- Default heading checks use eight headings at 45° increments, repeated twice with the second pass reversed (16 passes)
- Checks use constant elevation; terrain and sensor clearance are assessed separately
- Perpendicular tie lines use a default spacing of 10× the production-line spacing.
Method detailDetailed terrain-to-mission workflow
LiDAR reconnaissance
A separate mapping flight captures the survey area's terrain, surface and obstacle context before the long-line magnetic aircraft is committed.
Classified terrain model
Quality-controlled DTM represents bare earth; DSM and classified layers represent vegetation, structures and above-ground surface context.
Survey geometry
The Portal accepts irregular or multipart survey boundaries (Polygon/MultiPolygon), clips production lines to the actual AOI, and distinguishes a single grid, orthogonal dual-grid production and a separate wider-spaced orthogonal tie-line design, typically planned at 10× production spacing and editable from 5× to 20× once project geometry is confirmed.
Sensor-centric mission solve
The mission plans the magnetometer ground track, vertical sensor AGL, along-terrain speed, cable motion, line-entry settling and aircraft–cable–sensor clearance.
Complete mission feasibility
Sorties, safe return, reserve, turnaround, maintenance, continuation legs and one-to-three-aircraft allocation are solved with the acquisition geometry.
Field review
The survey team reviews the route, aircraft and sensor trajectories against the project design before the sortie; achieved performance is checked against recorded flight data.
Cloverleaf heading calibration
The project-level default uses a 50 m central measurement window (25 m half-length) with 16 crossings: eight headings at 45° increments, repeated twice with the second pass reversed.
- Constant-elevation checks use an automatic airframe ASL from the highest native DEM point within the cloverleaf manoeuvre footprint plus 60 m.
- Sensor clearance is assessed separately from the airframe surface.
- The manoeuvre footprint is computed from speed, tether, settling and turn radius.
Tie-line crossover control
Tie lines are perpendicular to production and provide recorded crossover evidence for QC and agreed levelling.
- Default spacing is 10×; a 50 m production grid therefore uses a 500 m tie-line example.
- Projects can use 5–20× spacing or an explicit spacing/count.
- Crossover positions, counts and angles remain available in the project record.
The planning model is not a certified measurement of helicopter thrust or collective authority. Configured aircraft limits, weather, installation, terrain and instrumented field validation govern what each project can accept.
From acquisition geometry to products a geophysicist can interrogate.
These views show how the acquisition becomes interpretation-ready products. A planning view explains the route or model; a magnetic product shows a processed response. BlueCap supplies the acquisition data, QC and processed magnetic products; geological interpretation remains with the client’s geophysicists.

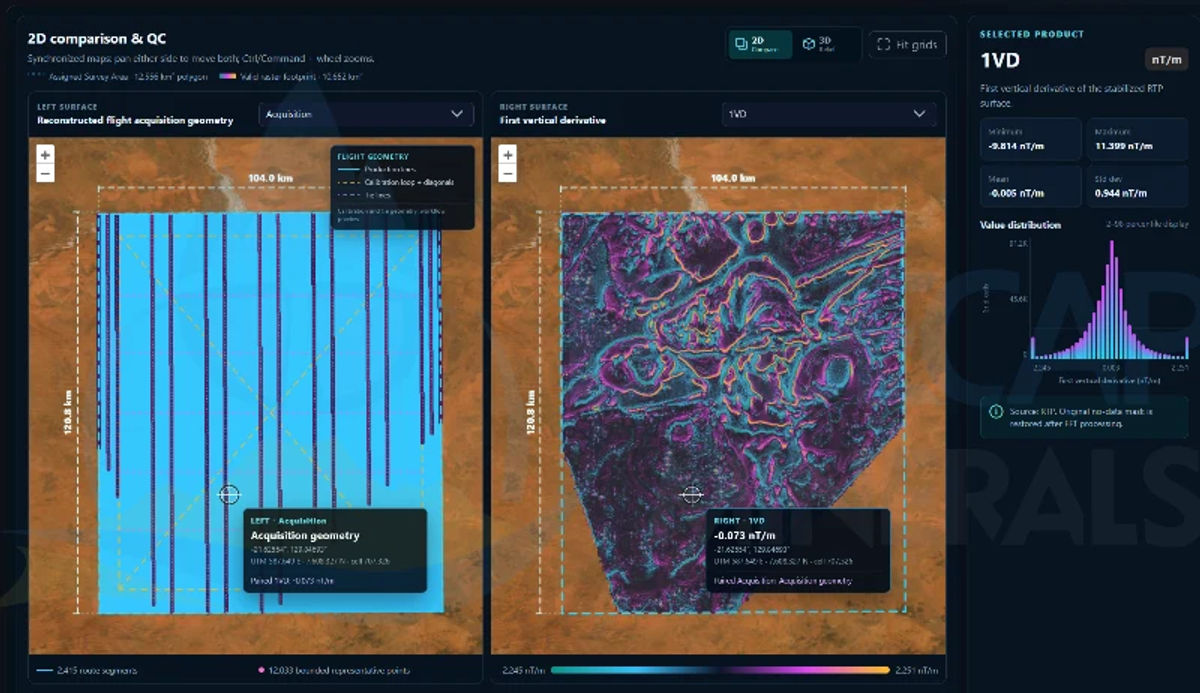
Acquisition geometry beside 1VD
The reconstructed flight geometry sits beside the first vertical derivative so line spacing and the derived short-wavelength product can be examined together.

Reduction to the pole relief
Colour carries the processed magnetic response and relief emphasises anomalies. The relief height is a magnetic display effect, not terrain elevation.

RTP + analytic signal
Two derived products can be compared over the same survey position, helping the interpreter examine source edges and field-direction effects together.

Second vertical derivative
The second vertical derivative brings higher-frequency structure forward while making acquisition noise, line control and processing choices more important to review.
Review magnetic products from one survey

- Survey area
- 12,555.6 km²104.0 × 120.8 km block
- Magnetic samples
- 251.6 M0.5 m along 125,781 km of line
- Six products, cold start
- 2.46 sResidual · RTP · 1VD · 2VD · AS · TILT
Evidence detailMeasured sensor-height research
Drag the sensor height and watch the anomaly lose definition
Move BlueCapBird Light and its integrated QuSpin QTFM Gen 2 sensor through the 25–50 m AGL range used in BlueCap's field experiment. This explorer applies a first-order 1/r³ compact-source model against the 35 m reference; it is a model of source-distance effects, not the observed site curves.
Calculated first-order dipole interpretation is shown separately from BlueCap's processed four-site observations. The field experiment reports 204 processed height conditions and a physical 34.5–35.5 m corridor; it is research evidence, not a universal spatial-survey error limit.
- Peak response vs 35 m
- 100%reference geometry
- Width at half response
- ≈54 mvs ≈54 m at the reference
Calibrated channels, clean payload and crossover evidence
Confidence comes from traceable controls: a low-noise quantum magnetometer on a magnetically clean suspended bird, measured sensor height, mission-specific calibration, crossover control, live QC and preserved raw data.

- QTFM Gen 2
Quantum sensing with a stated noise specification
The QuSpin QTFM Gen 2 sensor has a stated sensitivity below 3 pT/√Hz; usefulness still depends on platform, acquisition geometry and noise environment.
- 12.2 g
Non-magnetic towed payload
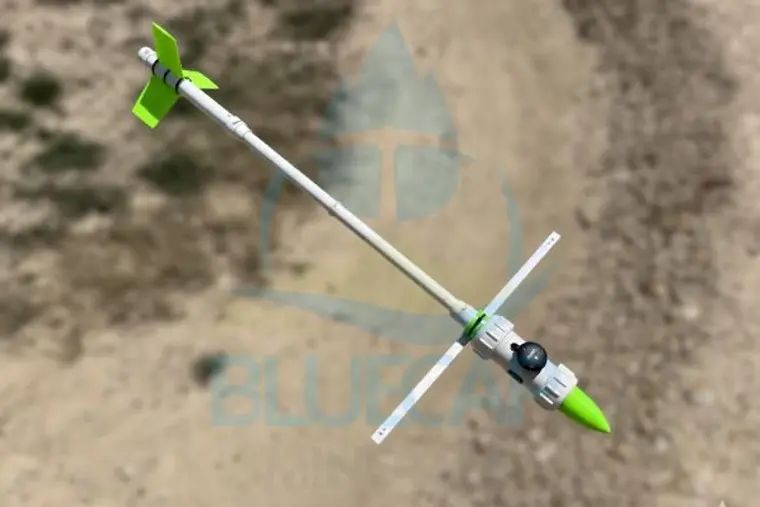
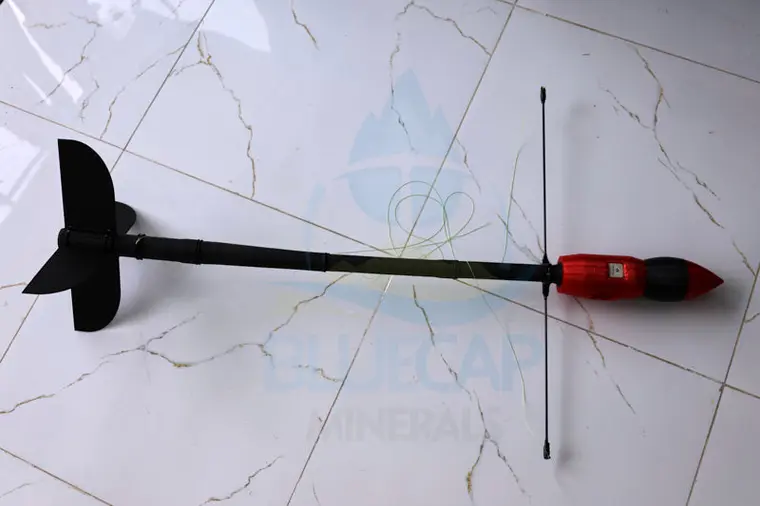
The complete towed BlueCapBird® carries 12.2 grams of metal, all more than a metre from the QTFM, and operates at least 20 metres below the helicopter.
- 120 m Range LiDAR
True sensor height on every sample
Independent Range LiDAR records actual sensor AGL for QC and project-specific height modelling; no universal scalar correction is assumed.
Three calibration controls in the project workflow
ZC calibration, project heading checks and tie-line crossover evidence are retained for QC review and agreed levelling.

Zero-crossing calibration
The operating point is selected for that day's magnetic environment and recorded in the mission workflow.

Constant-elevation cloverleaf checks
The default project routine uses eight headings 45° apart, repeated twice with the second pass reversed; terrain and sensor clearance are assessed separately.
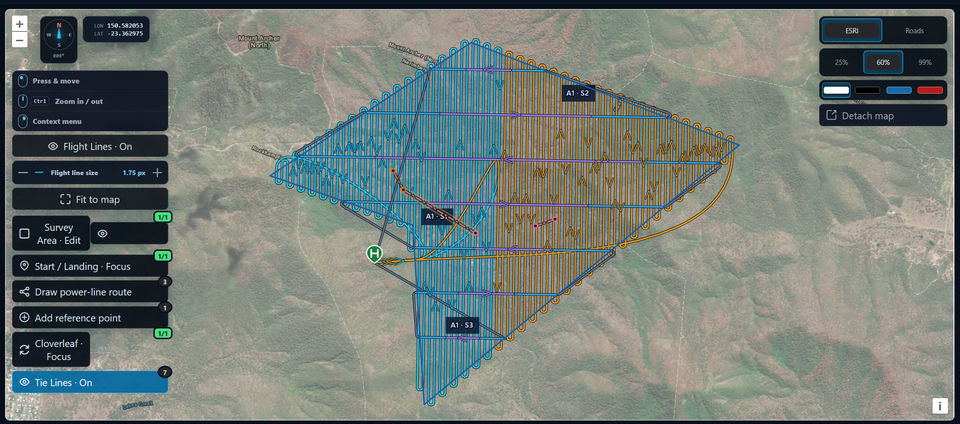
Tie lines
Perpendicular tie lines run at 90° to production; default spacing is 10× (for example, 50 m production lines and 500 m tie lines), editable to 5–20× or an explicit spacing/count. Recorded crossover positions, counts and angles support QC and agreed levelling.
Planning and product views are intentionally labelled separately. Geological interpretation and exploration decisions remain with the client’s geophysicists and depend on geology, ground truth, QC and the agreed processing scope.
Live raw magnetic data. Processed products in seconds.
Raw magnetic data and standard processed products are available in the BlueCap Survey Portal during acquisition. The original measurement stays alongside live computed products with no overwrite and no hidden smoothing, so geophysicists can review the record and call the field team while flying. Standard automated processing is included at no additional charge.
Raw measurements live
Airborne and base-station measurements remain available in the Portal during acquisition, with the original record preserved.
- UTC, GNSS, motion and true sensor-height channels
- Read-only PostgreSQL access
- Schema, field dictionary and source record retained
TMI plus six derived products
Standard automated processing produces GIS-ready Total Magnetic Intensity and six versioned magnetic surfaces.
- Residual · RTP · 1VD · 2VD · Analytic Signal · Tilt
- GeoTIFF/COG · GRD · KMZ · CSV and GeoJSON
- Products calculated in seconds during acquisition
QC and handover
A traceable handover keeps parameters, coordinate reference, QC evidence and delivery files together.
- Processing parameters and coordinate reference system
- QC report, processing manifest and field dictionary
- Source checksums and standard processed TMI output
From delayed file delivery to live review
Replace next-day file handover and week-long processing cycles with live review in the BlueCap Survey Portal during acquisition.
- Review raw data + products
- Call field team
- Pause, adjust, resume or reacquire as needed
Standard automated processing is included at no additional charge. Only agreed specialist staff time is charged for manual specialist work.
Products geophysicists can review live
Select a product view to inspect the same survey position across the processing record.
Full magnetic data and processing specification
The technical package keeps raw channels, standard products, QC, processing controls and export requirements together for the client’s geophysics and GIS workflows.
Synchronised measurement channels
The standard delivery includes a high-rate 60 Hz time-series database with synchronised onboard measurements.
Quantum magnetic channel
BlueCapBird Light · integrated QuSpin QTFM Gen 2 Quantum Rubidium Atomic Magnetometer- Downsampled from 1 kHz to 60 Hz using anti-alias polyphase FIR decimation
- Low-pass filter disabled
- Scalar magnetic field |B|
- Sensitivity/error metric
- Measurement validity flag
Motion, position & time
IMU · GNSS · UTC- Accelerometer Ax/Ay/Az
- Gyroscope Gx/Gy/Gz
- WGS84 longitude/latitude
- Ellipsoidal altitude
- HDOP + VDOP
- Millisecond-resolution GNSS time in UTC
Terrain clearance & power
LiDAR AGL · electrical state- LiDAR distance to the nearest reflective return
- Downsampled 400 Hz to 60 Hz
- Battery voltage
- Voltage consumption rate
Standard products
- TMI · Total Magnetic IntensityGIS-ready TMI grids with synchronised reference correction, IGRF removal and standard levelling.
- RES · Residual magnetic fieldThe residual magnetic surface retained as a traceable, versioned processing product.
- RTP · Reduction to the PoleA stabilised RTP surface with field, magnetisation and damping parameters preserved.
- 1VD · First Vertical DerivativeA first vertical derivative surface generated from the selected source product.
- 2VD · Second Vertical DerivativeA second vertical derivative surface for higher-frequency magnetic detail.
- AS · Analytic SignalAnalytic signal amplitude generated from the selected magnetic source.
- TILT · Tilt DerivativeA tilt-derivative surface supplied alongside the source and other magnetic products.
Processing controls
Magnetic field model
- Magnetic-field and magnetisation direction
- RTP stabilisation damping
- Upward continuation
Filters and FFT
- Low-pass and high-pass wavelengths
- Butterworth order
- FFT edge taper and reflected padding
Product and colour
- Derivative and Analytic Signal source products
- Percentile stretch
- GEO/RGB/diverging/greyscale palettes
- Magnetic-layer opacity
3D presentation
- Magnetic-relief vertical exaggeration
- Terrain vertical exaggeration
- 3D camera position
Synchronous 2D comparison
Pan and zoom source and processed surfaces together while inspecting the same survey position.
3D magnetic drape
Review magnetic products on a flat plane or draped over the available real terrain model.
Point-value inspection
Hover across selected products or pin one grid cell for a persistent side-by-side comparison.
Processed magnetic products in seconds
Changing a processing parameter starts a server-side recalculation; repeated requests with the same parameters are served from cache.
- Grid
- 859 × 1,006 cells
- Duration
- 2–3 seconds for all standard products
- Scale
- 500 million airborne and ground magnetometer data points
Exports and traceability
- GeoTIFF and Cloud Optimized GeoTIFF
- Surfer GRD and Arc/Info ASCII Grid
- PNG, Google Earth KMZ, CSV and GeoJSON
- Processing manifest and QC report
QGIS, ArcGIS Pro, Oasis montaj, Surfer, Global Mapper, Python and MATLAB.
Every calculation records parameters, coordinate reference system, sensor height, source checksum and complete data lineage. The cloud-secured PostgreSQL connection is read-only; project-specific credentials and IP whitelisting secure the connection. Database connection details, schema, field dictionary, projection information, QC report, export files and standard processed TMI output.
Optional manual processingA$2,550 · per working day · time and materials
Custom geophysical processing & data engineering
Custom correction, levelling, mixed-sensor processing, workflow development, big-data post-processing and project-specific data engineering are available at A$2,550 per working day. Copying and transferring project data is not charged. BlueCap supplies acquisition data, QC and processed magnetic products; geological interpretation and exploration decisions remain with the client’s geophysicists.

Custom geophysical processing
- Custom correction, levelling, microlevelling and signal conditioning
- Legacy and mixed-sensor datasets
- Bespoke filters and derived products
Big-data post-processing
- Multi-flight and multi-vintage batches
- Data harmonisation and QA/QC
- Repeatable server-side pipelines
Data engineering and QA/QC
- Schema and field-dictionary work
- Repeatable delivery pipelines
- Project-specific exports and technical records
Inputs, methods, outputs and acceptance criteria are agreed before processing begins; results preserve source checksums, parameters and version history.
- Custom data productsProject-specific grids, transforms, extracts and presentation outputs.
- Big-data processing recordRun parameters, logs, data lineage, QA/QC summaries and source checksums.
- Technical data packageMaps, tables, processing records and technical notes organised around the agreed data requirements.
Plan your next magnetic survey.
A survey polygon, line-spacing preference, terrain context and intended decision are enough to start a scoped conversation. BlueCap can then review method, coverage, approvals, deliverables and a project-specific quotation.

Integrated aircraft and field team
BlueCapHeli®, BlueCapBird®, remote pilots, geophysicists and processing specialists stay in one accountable survey workflow.
See the carrier system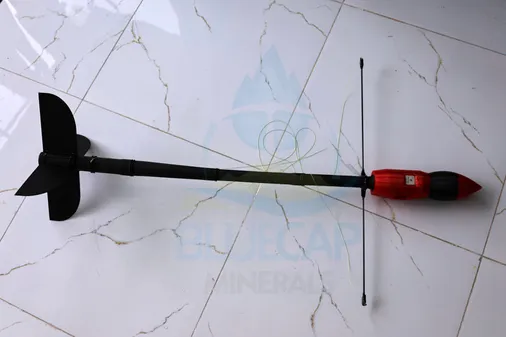
The sensor is part of the service
BlueCapBird® Light and Fast variants use the QuSpin QTFM Gen 2 architecture, selected around the required terrain, speed and survey geometry.
See the sensor system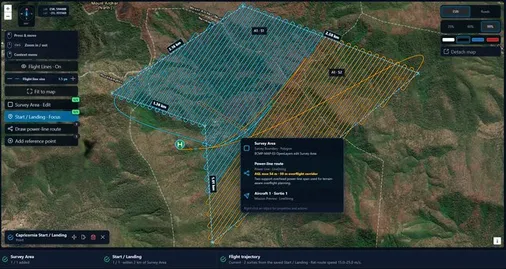
Review the route before mobilisation
Survey geometry, terrain evidence, proposed resources, deliverables and constraints can be reviewed together before the project becomes a field programme.
Explore BlueCap PortalWhat is the indicative planning rate?
BlueCap does not bill magnetic surveys by line-kilometre. The Portal calculates an indicative project budget from the client-drawn Area of Interest, line spacing, planned aircraft and equipment, actual staff time, equipment wear and usage, and materials. A 50 m grid with a 25 m infill changes the expected time and resources; it is not an added per-kilometre charge. Planned project quotes are calculated in the Portal in about 5–10 minutes, subject to the agreed scope.
How does this compare with one electric survey drone?
The current planning comparison uses about 600–1,250 line-km/week for one electric survey drone and 10,500 line-km/week for one BlueCapHeli® system: approximately 8–18× on that five-day planning basis. Area still depends on line spacing, terrain, approvals, turns, tie lines and field conditions.
What does ±0.5 m mean here?
It is the model corridor above or below the planned sensor height over the terrain-following reference.
What is the ±1 m corridor?
It is the left–right model corridor extending ±1 m to either side of the planned survey line, measured at the magnetometer.
What magnetic products are included?
The standard package includes live raw data during acquisition, the unchanged RAW record, base-station reference data, GIS-ready TMI grids, Residual, RTP, 1VD, 2VD, analytic signal and tilt derivative products, with standard automated processing included at no additional charge.
Can you process existing or third-party magnetic data?
Yes. BlueCap supplies acquisition data, QC and processed magnetic products. Geological interpretation and exploration decisions remain with the client’s geophysicists. Custom correction, levelling, mixed-sensor processing, big-data post-processing, workflow development and project-specific data engineering are available at A$2,550 per working day, with scope agreed before work begins.
What should we send first?
A survey polygon or approximate area, location, geological question, preferred line spacing, terrain or access constraints and any existing data are a useful starting brief.
One accountable aircraft, sensor and field workflow
BlueCapHeli®, BlueCapBird®, geophysicists, remote pilots, processing specialists and the Survey Portal remain connected from scope through final QA.

BlueCapHeli®
Carrier endurance, speed and terrain authority for large low-level magnetic survey programmes.
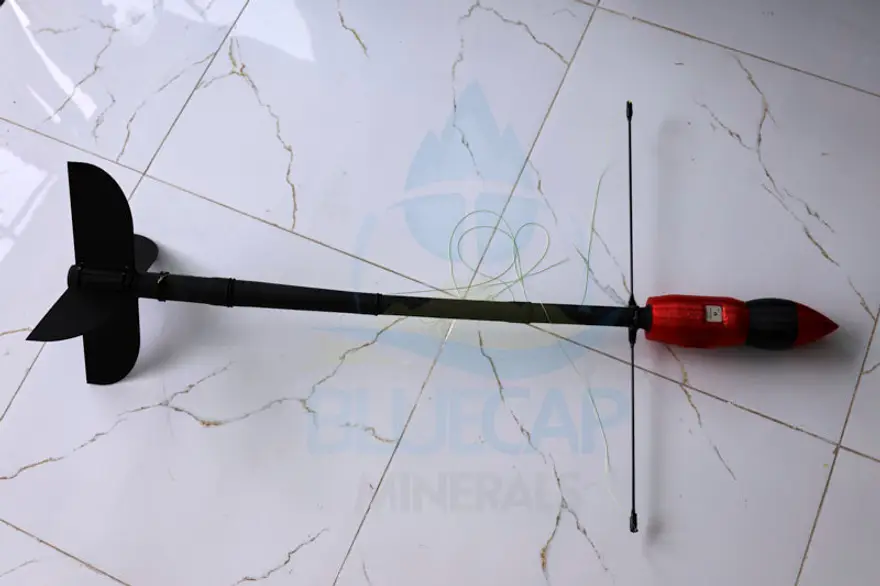
BlueCapBird® Light & Fast
Light supports detail surveys and Fast supports higher-speed terrain-hugging acquisition; the same instrument can serve as a base station for diurnal control.

BlueCap Survey Team
One accountable team works from acquisition planning through final QA.
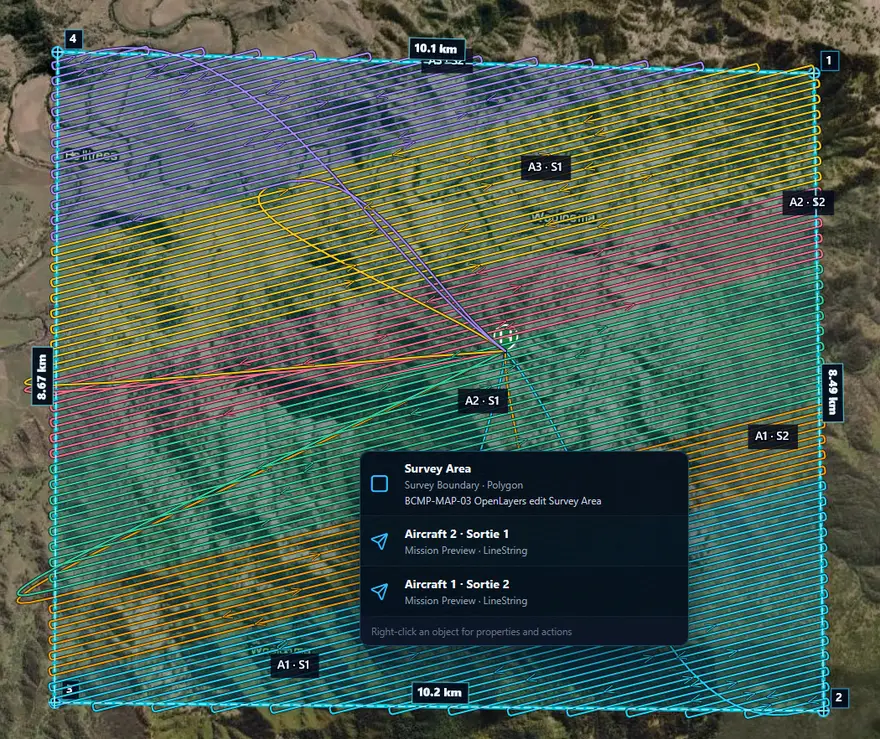
Automated Survey Workflow
Survey design, quotation, field acquisition, processing, review and delivery remain connected in one project workspace.

We don't fly magnetic surveys so you or your investors get pretty coloured pictures. We fly them so your next drilling programme actually pays off — the right holes, in the right spots, without burning budget on misses. Everything we build, from the aircraft to the software, is aimed at exactly that.