25 m lines
Detailed K · eU · eTh mapping
- Line-km / week
- ≈1,500
- km² / day
- ≈8
- km² / week
- ≈40
BlueCap Australia
BlueCap drone radiometric surveys use the Medusa MS-1000 gamma-ray spectrometer to deliver traceable K, eU, eTh and total-count mineral mapping.

SENSOR-CENTRIC FULL-PHYSICS PLANNING
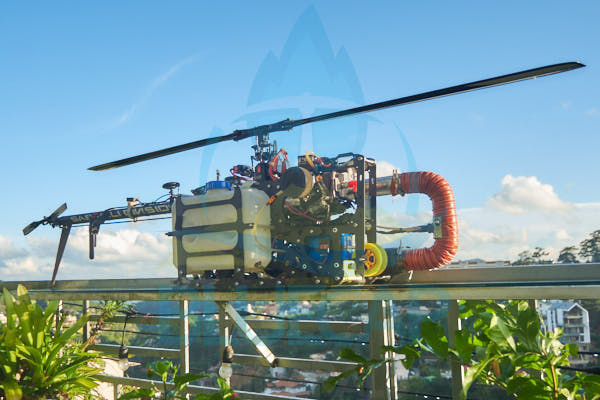
We calculate terrain-following height and acquisition speed together in a full-physics simulation. BlueCapHeli® follows the resulting trajectory with exceptional precision.
Explore survey designBlueCap delivers drone radiometric survey and gamma-ray mapping services for mineral exploration across Australia and worldwide. Low-level mission design, Medusa MS-1000 acquisition, spectral processing and reviewable K, eU, eTh and total-count products remain inside one BlueCap-operated workflow.
Explore BlueCap’s integrated drone geophysical survey services.
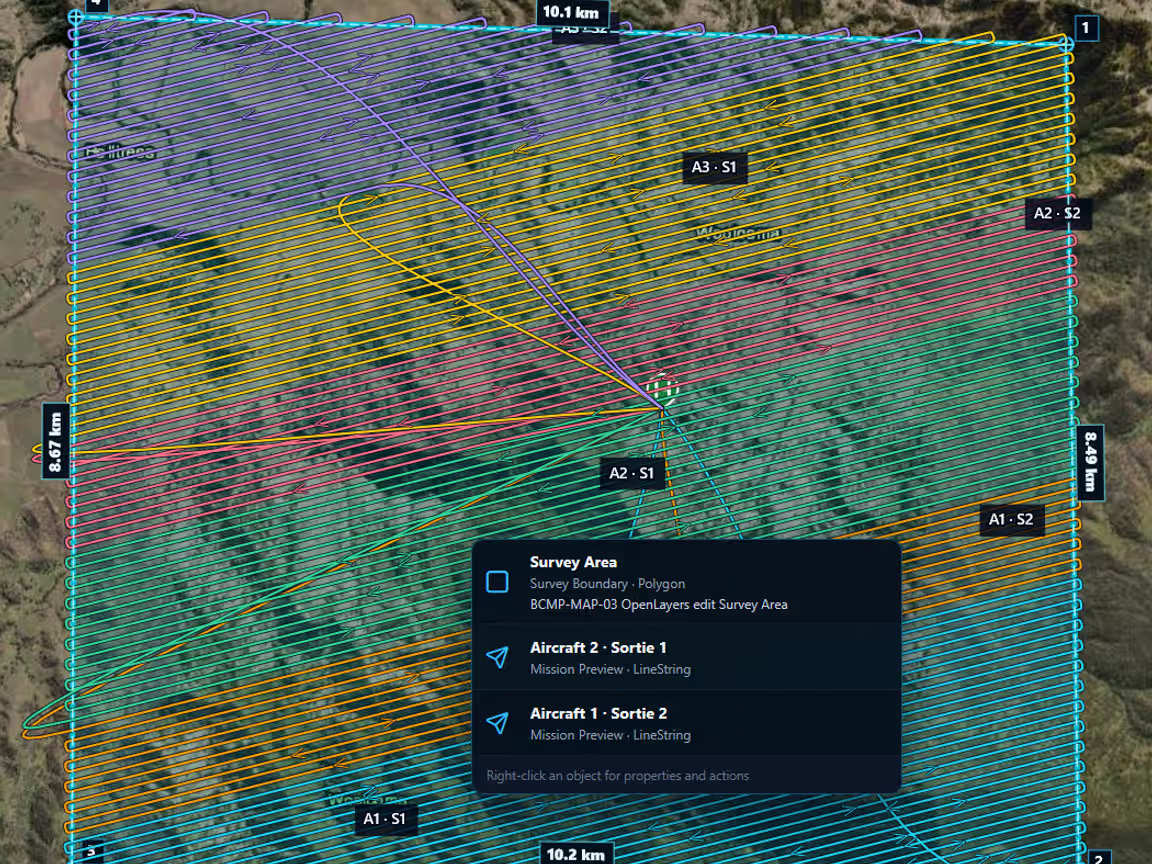
Gamma-ray mapping is flown at 35 m and 15 km/h because count statistics demand it; the BlueCapHeli® survey system keeps the block size at exploration scale. Clients normally select 25 m or 50 m lines; 100 m is a draft-mapping option. Figures are planning values for the BlueCapHeli® system over five flying days.
Detailed K · eU · eTh mapping
Standard exploration product
Draft mapping before a tighter survey
| Line spacing | Line-km / week | km² / day | km² / week |
|---|---|---|---|
| 25 m linesDetailed K · eU · eTh mapping | ≈1,500 | ≈8 | ≈40 |
| 50 m linesStandard exploration product | ≈1,500 | ≈15 | ≈75 |
| 100 m linesDraft mapping before a tighter survey | ≈1,500 | ≈31 | ≈150 |
Radiometric productivity is set by count statistics first; speed is held relative to the terrain and line spacing is agreed with the client before route release.
BlueCap integrates the Medusa Radiometrics MS-1000 gamma-ray spectrometer with the aircraft, mission design, field crew, live detector view and controlled data workflow. The client commissions a survey and defined geological products — not an unsupported sensor rental.
BlueCap integrates the 3 × 9 inch shock-resistant scintillation detector as part of the complete airborne system.
The complete mission payload must also include mounting, cabling, power and integration hardware.
The system records five spectra per second; this does not mean five statistically independent final maps every second.
The physical envelope is included in BlueCap mounting, balance, clearance and aircraft-integration checks.
Onboard capacity provides substantial headroom for long field records while project data is also controlled through the BlueCap workflow.
BlueCap plans inside the instrument operating range of −20 to +65 °C while applying separate aircraft and mission weather limits.
The MS-1000 is integrated into BlueCap's 3-hour and 8-hour BlueCapHeli® models. Mounting, balance, vibration, airflow, 25 V power, communications, landing clearance and safety are qualified as complete aircraft configurations.
The scintillation crystal records the energy distribution of gamma photons with the efficiency required for drone-scale ground mapping.
Detector storage and near-real-time review support acquisition checks and reflight decisions without replacing final processing.
Source spectra, position, processing parameters, grids, tables, QC decisions and exceptions remain connected in the project record.
A larger scintillation volume can improve count statistics when geometry and integration time are equal. It also consumes payload margin and can change speed, altitude or endurance. BlueCap therefore compares detector material and volume, flight-installed mass, synchronisation and quality control together — not model name or kilograms alone.
BlueCap selected and integrated the MS-1000 for its current service configuration. Within the MS-700, MS-1000 and MS-2000 family, it provides the largest detector volume that remains within BlueCapHeli®'s 9.5 kg payload screen at a 6.7 kg instrument mass.
700 ml CsI · 3 × 6 inch
1000 ml CsI · 3 × 9 inch
2000 ml CsI · 90 × 310 mm
RS-530 and GS-1 are lighter instruments, but their detector material, volume, aircraft platform, software and integration basis differ. The comparison explains engineering trade-offs; it does not assume the systems will produce equivalent results.
0.39 L NaI(Tl) · 3 × 3 inch · K, U and Th spectral system
0.34 L NaI(Tl) or 0.40 L CsI(Tl)
The MS-1000 records a full gamma-energy spectrum at each observation. Calibrated window analysis or Full Spectrum Analysis can estimate the relative contribution of potassium, equivalent uranium and equivalent thorium, together with total count and agreed ratio products.
Can help distinguish lithologies, potassium-rich alteration or surface materials where the geological contrast is strong enough and independently checked.
A radiometric estimate based on decay products and equilibrium assumptions — not a direct uranium assay or radiation-safety determination.
Can support mapping of parent material, regolith and lithological variation while remaining sensitive to surface conditions.
Total count and ratios such as K/eTh, eU/eTh or eU/K can highlight contrasts when calibration, corrections and metadata remain intact.
Compare surface units whose radioelement signatures differ enough to complement field mapping.
Test potassium or ratio patterns against an alteration model rather than treating colour contrast as mineralisation.
Add context to weathering, transported cover and near-surface material changes alongside terrain and samples.
Identify near-surface radiometric contrast for specialist follow-up without replacing assay, equilibrium review or safety controls.
Each mapped element is estimated from a standard energy window on the recorded spectrum. Select a channel to highlight its window and the photopeak it is anchored to.
Potassium is measured directly from its own K-40 decay. In mapping it responds to potassium feldspar, micas and potassic alteration — a primary vector in many hydrothermal systems.
Windows follow the standard IAEA airborne gamma-ray spectrometry convention — potassium at the 1.46 MeV K-40 photopeak, equivalent uranium at the 1.76 MeV Bi-214 photopeak, equivalent thorium at the 2.62 MeV Tl-208 photopeak. The drawn spectrum is an illustrative shape for reading the windows, not project data.
Productive area cannot be separated from gamma count statistics. Aircraft speed, terrain clearance, line spacing, footprint, background concentration and required map resolution must be designed together before line-kilometres or daily production are quoted.
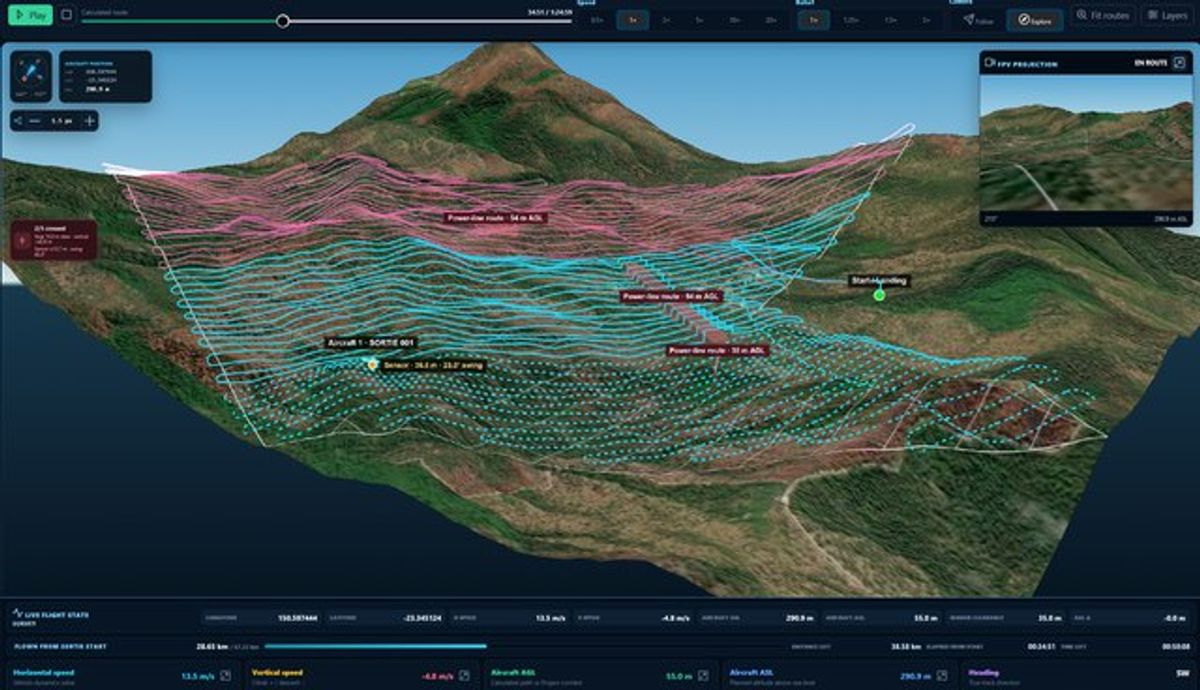
Our terrain-following setpoint keeps the detector above typical tropical and subtropical tree height while preserving useful near-surface response.
Clients normally select 25 m or 50 m lines for the required product. In some cases, 100 m spacing is used for draft mapping.
Stable terrain-relative ground speed balances productive area with consistent spectral acquisition; 20 km/h is the sensor operating maximum.
The detector records five spectra per second; count uncertainty and processing determine usable information density.
BlueCap treats detector power endurance separately from each BlueCapHeli® flight leg, fuel plan and total mission duration.
BlueCapHeli® supplies a controlled 25 V feed to the integrated detector, with approximately 3 W average and 6 W maximum demand.
BlueCap uses a controlled acquisition geometry rather than selecting an arbitrary value from a sensor range. The three settings below are designed as one system.
Area, relief, take-off sites, obstacles, exclusion zones and legal operating constraints define the feasible geometry.
The target model, expected dimensions and decision the map must support determine whether radiometric contrast is useful.
Geological, geochemical, magnetic, LiDAR, DEM and previous radiometric data show the actual information gap.
Required K–eU–eTh products, resolution, raw data, formats, metadata and QC criteria are agreed before mobilisation.
A radiometric delivery should not collapse source spectra into a few attractive rasters. Every mapped product must remain traceable to observation time, GNSS, detector state, flight geometry, correction parameters, spectral method, grid settings and the QC decisions applied to the project.
Review timing, GNSS, detector state, flight gaps, altitude, speed and spectral behaviour before accepting each sortie.
Check live/dead time, energy stability, background, drift and the calibration information applicable to the configuration.
Consider altitude, air density, atmospheric radon, moisture and changing surface conditions where they affect comparability.
Apply the agreed window analysis or Full Spectrum Analysis with calibration and stripping parameters preserved in the record.
Generate consistent K, eU, eTh and total-count products without smoothing away narrow contrasts or concealing seams.
Record software version, exceptions, acceptance criteria, reproducibility information and the limits of interpretation.
Spectra, time, position, detector state and agreed corrected values in documented machine-readable formats such as JSON, NMEA or CSV where applicable.
K, eU, eTh, total-count and approved ratio grids, rasters, contours or vectors with CRS, datum, cell size, units and no-data definition.
Processing record, calibration references, parameters, reflight notes, exceptions and interpretation cautions required for defensible reuse.
Airborne gamma response is affected by distance to the surface, soil moisture, vegetation, cover, radon, terrain, material distribution and count statistics. Radiometric products become valuable when they answer a defined geological question and are checked against independent evidence.
Radiometric K, eU and eTh do not replace sampling, laboratory QA/QC, direct uranium chemistry or a geochemical model.
The signal is dominated by near-surface material; deep targets or targets beneath substantial cover may not create a direct surface signature.
Moisture, transported cover, vegetation, sensor height and atmospheric radon can weaken or change the measured response.
An anomaly does not establish orebody geometry, grade, thickness, tonnage, a mineral resource or an ore reserve.
Near-surface radioelement variation, lithology, regolith and alteration context.
Drone radiometric survey and K–eU–eTh mappingMagnetic susceptibility contrast, structures, intrusions and deeper-source architecture.
High-fidelity drone magnetic surveyTerrain, vegetation structure, access geometry and controlled low-level flight planning.
Drone LiDAR survey and terrain mappingConnect geophysics, terrain products, project evidence and specialist follow-up around one exploration decision.
Integrated mineral exploration survey services
These are the acquisition parameters BlueCap uses to design and deliver the service. The client confirms the required line spacing and outputs before final route release; BlueCap controls the AGL setpoint, stable mapping speed, aircraft integration, field QC and processing workflow.
Choose a 25 m or 50 m radiometric grid to check a current reference Quote range. The range includes mobilisation and remains subject to a project-specific review.
Loading current Quote range…
Project enquiry
Start with your survey area and the data you need. We’ll help define the scope, review terrain-aware 2D and 3D flight plans, and keep field progress, processed data and deliverables together in the BlueCap Survey Portal.
No software subscription fee for BlueCap service projects.