BlueCap Australia
Flood, erosion & terrain: measure the surface first
Start with a reliable elevation and landform record, then give the right evidence to the right specialist.
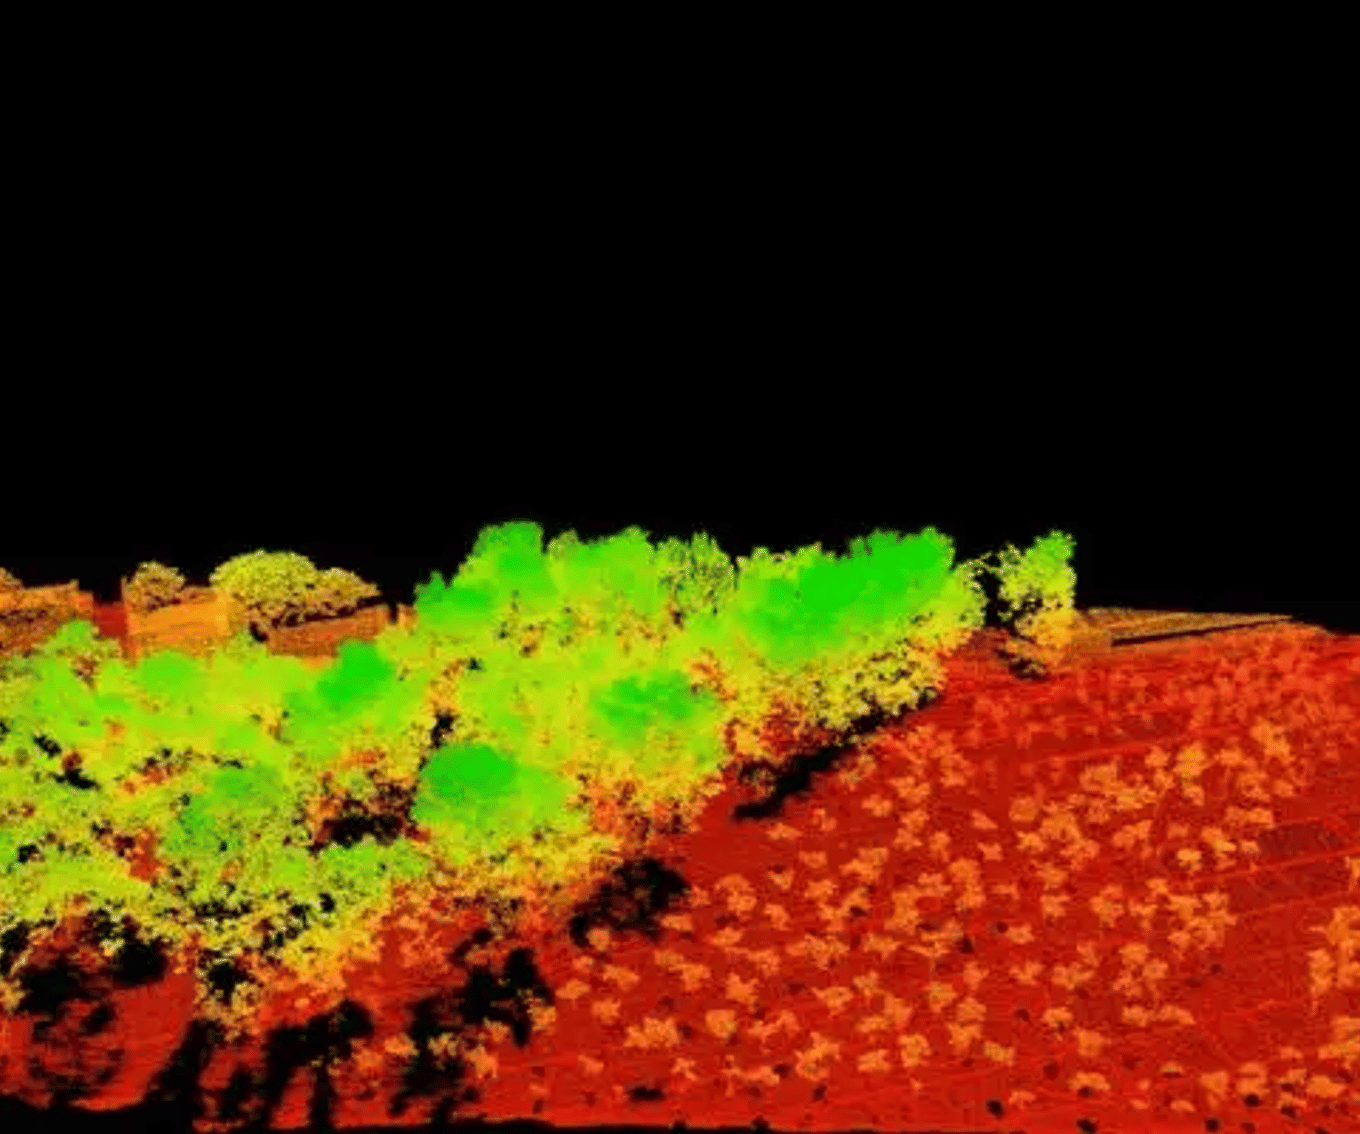
When the question is “what does the ground look like now, and where might water or sediment move?”, start with reliable terrain evidence. A topographic LiDAR survey can provide an elevation record across accessible land, then be reviewed with drainage, vegetation, imagery, field observations and, where needed, specialist modelling. It is an evidence survey, not a forecast.
Start with a measured baseline
Give the right terrain record to the right downstream decision.
Useful outputs to discuss
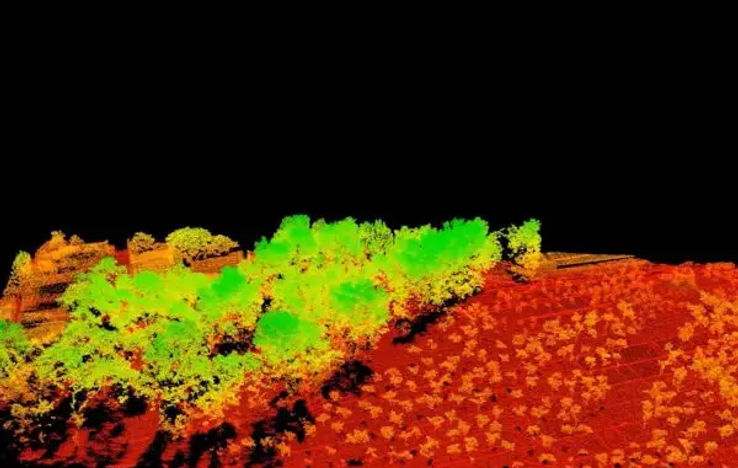
- Bare-earth terrain and surface products with datum and capture information
- Contours, slope, profiles or change surfaces suited to the brief
- A traceable package for hydraulic, coastal, geotechnical or civil review
Define the change
State whether the decision is a baseline, repeat comparison, visible feature review or model input.
Capture compatible terrain
Agree the boundary, datum, output and earlier dataset before comparing surfaces.
Put it in context
Review terrain with drainage records, imagery and field evidence before specialist modelling or design.
What this survey is for
Choose a terrain survey when you need to document low points, breaks of slope, drainage paths, banks, dunes, gullies or erosion features; establish a baseline before a wet season, storm or later inspection; compare compatible repeat surveys; or provide terrain information to an engineer, hydrologist, hydraulic modeller, coastal specialist or geotechnical professional.
What you can ask for
- survey extent and capture date;
- nominated coordinate reference system and vertical datum;
- point-cloud and classification information where applicable;
- bare-earth terrain and surface models;
- contours, hillshade, slope, profiles or cross-sections;
- mapped terrain observations and GIS-ready outputs; and
- metadata recording coverage, processing and known gaps.
For a change question, agree the earlier dataset, extents, datum, comparison method and reporting threshold before capture. A before-and-after result is only useful when datasets are suitable to compare.
What topographic LiDAR does not answer
It is not bathymetry. Ordinary topographic LiDAR should not be treated as a riverbed, lakebed or seabed measurement through water. Bathymetric LiDAR is a different method using a green laser, and sonar is generally used for most bathymetric work. Geoscience Australia explains the distinction.
It is not a flood prediction. Terrain is an important input to an appropriately designed hydrologic or hydraulic assessment; it does not predict timing, depth, velocity or affected properties by itself.
It is not design, certification or a stability clearance. Visible patterns can identify areas for further investigation but do not establish erosion cause, buried materials, groundwater behaviour, structural integrity or future slope performance.
A practical evidence pathway
- Define whether the decision is a current baseline, repeat comparison, model input or visible-feature investigation.
- Set a boundary that includes the terrain influencing the question.
- Confirm datum and control requirements against plans, gauges or existing survey data.
- Capture and process the terrain record, distinguishing ground from surface or vegetation products.
- Review it with site photographs, drainage information, water levels, imagery and field inspection.
- Give the package to the appropriate hydraulic, coastal, geotechnical or civil specialist when the decision concerns prediction, design, certification or stability.
Published examples: evidence, not a promise
For a 1998 River Severn flood in the United Kingdom, Cobby, Mason, Horritt and Bates used airborne laser-altimetry terrain and vegetation inputs to construct a two-dimensional hydraulic model, then compared predicted flood extent with radar imagery. The useful distinction is the workflow: LiDAR supplied inputs; the hydraulic model produced predictions. Read the 2003 study. It is a single UK research case, not an Australian result or a universal model outcome.
In a separate US coastal example, Sallenger and co-authors used pre- and post-storm topographic LiDAR to quantify beach and dune change after Hurricane Dennis. See the USGS publication record. It demonstrates repeat terrain observation, not a prediction for another coast or event.
Briefing checklist
- site boundary, access and area of concern;
- decision to support and whether a current or repeat survey is needed;
- known drains, creeks, culverts, banks, assets or erosion locations;
- existing survey, GIS, design, water-level, imagery or model information;
- required coordinate system and vertical datum;
- downstream users and requested formats; and
- explicit notice if bathymetry, field cross-sections, modelling, engineering, certification or stability advice is required.
References and next reading
- Cobby, D. M., Mason, D. C., Horritt, M. S. & Bates, P. D. (2003), “Two-dimensional hydraulic flood modelling using a finite-element mesh decomposed according to vegetation and topographic features derived from airborne scanning laser altimetry”, Hydrological Processes 17, 1979–2000. DOI: 10.1002/hyp.1201. River Severn, UK, 1998 event.
- Sallenger, A. H. et al. (2001), “Quantifying hurricane-induced coastal changes using topographic lidar”. USGS publication record. US Hurricane Dennis case.
Return to Choose a survey, see the detailed LiDAR terrain mapping page, browse BlueCap drone survey services, or discuss the site boundary and intended decision.
Project enquiry
Let’s plan your survey
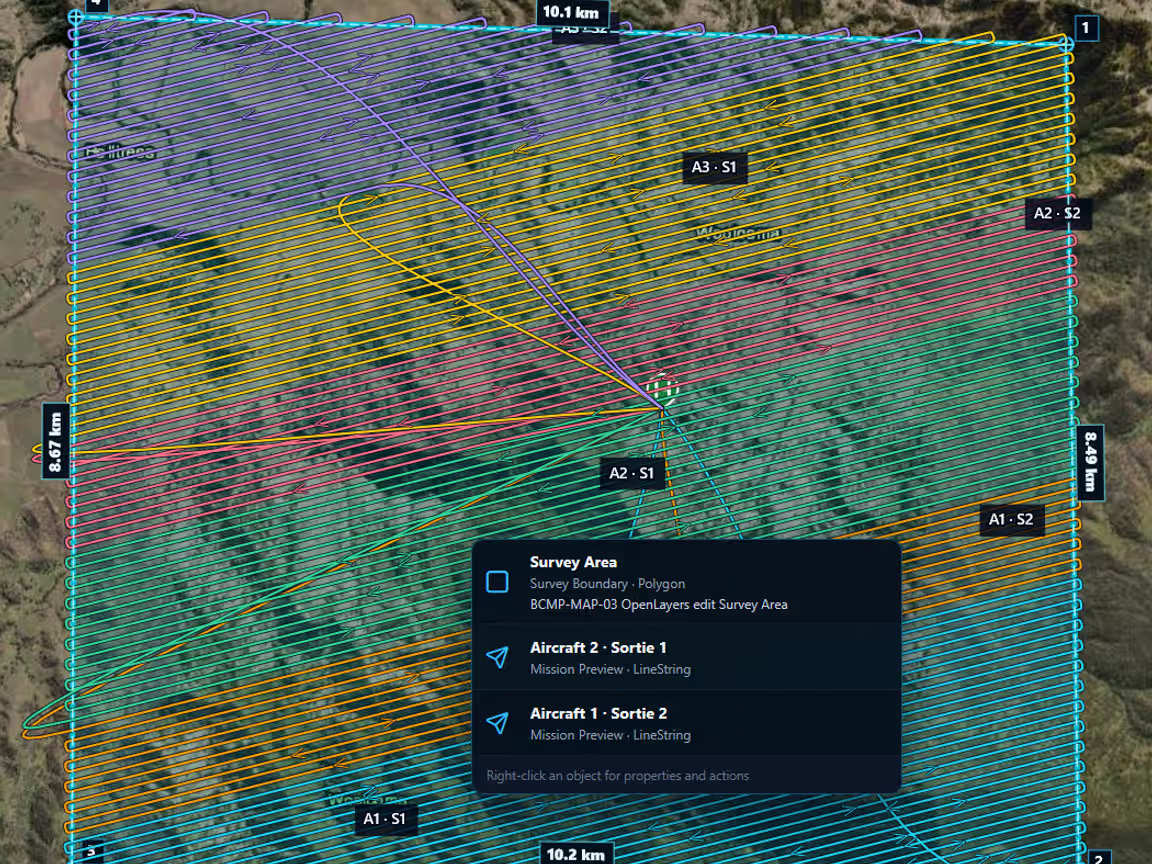
Start with your survey area and the data you need. We’ll help define the scope, review terrain-aware 2D and 3D flight plans, and keep field progress, processed data and deliverables together in the BlueCap Survey Portal.
No software subscription fee for BlueCap service projects.