BlueCap Australia
Forestry & vegetation: separate observation from estimate
See vegetation structure and terrain across a landscape, while keeping field calibration at the centre of inventory decisions.
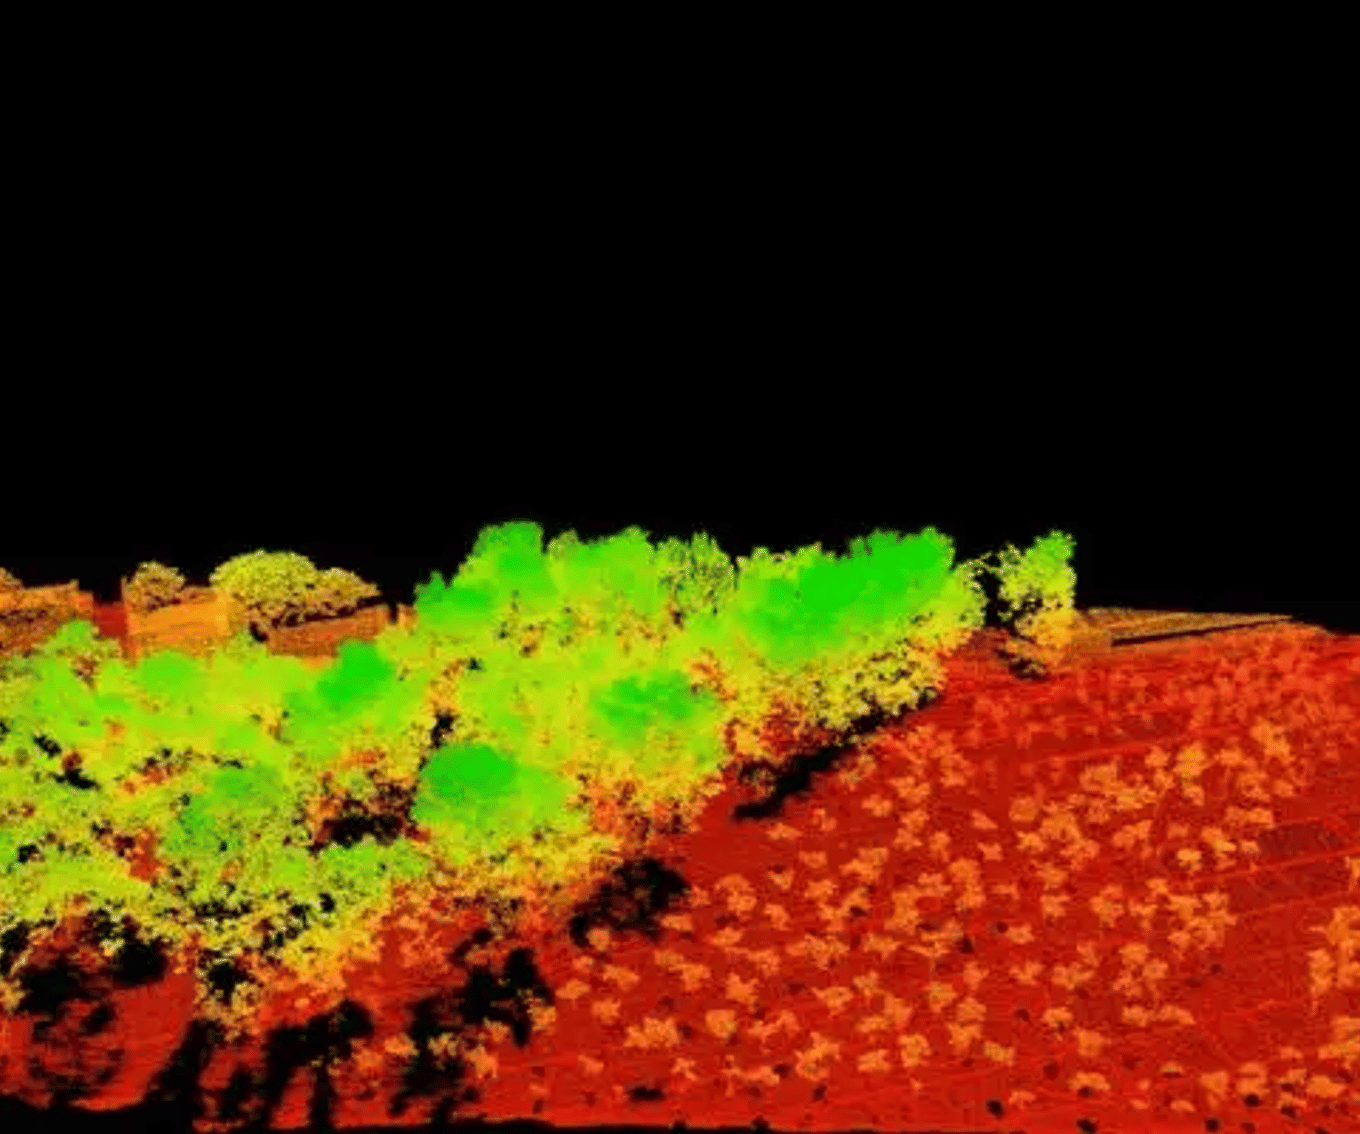
LiDAR can provide three-dimensional evidence of the ground and vegetation across a landscape. It can help answer how canopy height and structure vary, what terrain sits beneath vegetation, where field plots should represent different stands, and how field inventory observations might be extended into mapped estimates.
The key distinction is simple: LiDAR records reflected laser returns and their positions. Attributes such as timber volume, biomass or stocking are estimates produced by combining LiDAR-derived metrics with suitable field measurements and a documented model. They are not read directly by the sensor.
Observation first, estimate second
Connect canopy structure to the field data that makes an inventory useful.
Useful outputs to discuss
- Terrain, surface and canopy-height products with clear definitions
- Stand or grid summaries of observed vegetation structure
- Calibrated estimates only where representative field data and validation are included
Define the attribute
Separate a directly mapped height or canopy metric from a modelled inventory quantity such as volume or biomass.
Build the spatial layer
Classify ground, normalise vegetation height and derive metrics at the same scale as the reporting unit.
Calibrate with plots
Use representative field measurements to test the relationship and report uncertainty with the result.
What LiDAR can show
Depending on scope and processing, useful outputs can include a classified point cloud, bare-earth terrain model, surface model, canopy-height model, terrain derivatives, canopy or return-density metrics with stated definitions, and height summaries by grid, stand or management unit. Australia's State of the Forests Report identifies terrain, drainage, roads, slopes and forest height among LiDAR applications. Read the report.
Specify what terms such as canopy cover, height or vegetation condition mean for the decision. A return-based metric above a stated height threshold is not automatically the same as crown cover from imagery or a field ecological assessment.
When the question is inventory
For stand height, stocking, basal area, volume or biomass, start with the reporting unit and acceptance criteria. Field plots, measured consistently and accurately located, are the reference observations that connect LiDAR structure to the requested attribute. A prediction map is not a substitute for an inventory design.
From point cloud to an inventory estimate
- Define coverage, coordinate system, acquisition timing and required outputs.
- Classify ground, model terrain and derive vegetation metrics at the same support as field plots or reporting cells.
- Measure representative field plots using a consistent protocol.
- Calibrate and validate an appropriate model, reporting predictive error rather than assuming it.
- Deliver mapped estimates with aggregation, uncertainty, model domain and exclusions.
McRoberts, Chen and Walters used airborne laser scanning as auxiliary information in a north-central Minnesota forest-inventory study. Their multivariate model-assisted approach produced compatible estimates for six inventory parameters and lower variance than the comparison post-stratified estimator. Read the US Forest Service paper and DOI. This supports the inference workflow; it does not make volume or biomass a direct LiDAR measurement or create a universal accuracy claim.
Biomass and volume: useful estimates, not direct readings
Relationships between LiDAR structure and biomass or volume can vary with species, age, stocking, silviculture, site, management history, allometric equations, plot definition and acquisition settings. Do not carry a model into a new forest type, survey configuration or time period without checking that its calibration data cover the new conditions. Canopy density, steep terrain, point density and field-plot location can also affect agreement.
An Australian example, with its limits
An Australian National University project in south-central Queensland used a LiDAR sample and field plots across broad woodland and community types to develop local biomass estimates. The project describes ground and non-ground returns being used to create bare-ground context and vegetation height above ground. Its reported model results belong to that study area, plot sample, acquisition settings and model, not another forest or project. Read the Injune study description.
Typical deliverables to discuss
- classified point cloud, terrain, surface and canopy-height products;
- canopy or vegetation-structure summaries with clear definitions;
- mapped inventory estimates only where field calibration and validation are agreed;
- plot, model and uncertainty documentation; and
- GIS-ready layers, coverage notes and known exclusions.
Briefing checklist
- boundary, excluded areas and decision to support;
- priority on terrain, canopy, inventory, change or a combination;
- required units, reporting scale and forest or vegetation types;
- age, harvesting or fire history, access and safety constraints;
- existing LiDAR, imagery, stand boundaries and inventory data;
- existing field plots, their measurement method and location quality;
- required direct spatial products versus calibrated estimates;
- survey timing, coordinate system, datum, formats and uncertainty requirements.
References and next reading
- McRoberts, R. E., Chen, Q. & Walters, B. F. (2017), “Multivariate inference for forest inventories using auxiliary airborne laser scanning data”, Forest Ecology and Management 401, 295–303. US Forest Service record; DOI: 10.1016/j.foreco.2017.07.017. Minnesota study; not a universal inventory-performance result.
- Culvenor, D. et al. (2005), Evaluation and validation of canopy laser radar systems for native and plantation forest inventory. Australian validation context.
Return to Choose a survey, see LiDAR terrain mapping, explore the wider drone survey and mapping services BlueCap operates, or discuss the required decision and available field data.
Project enquiry
Let’s plan your survey
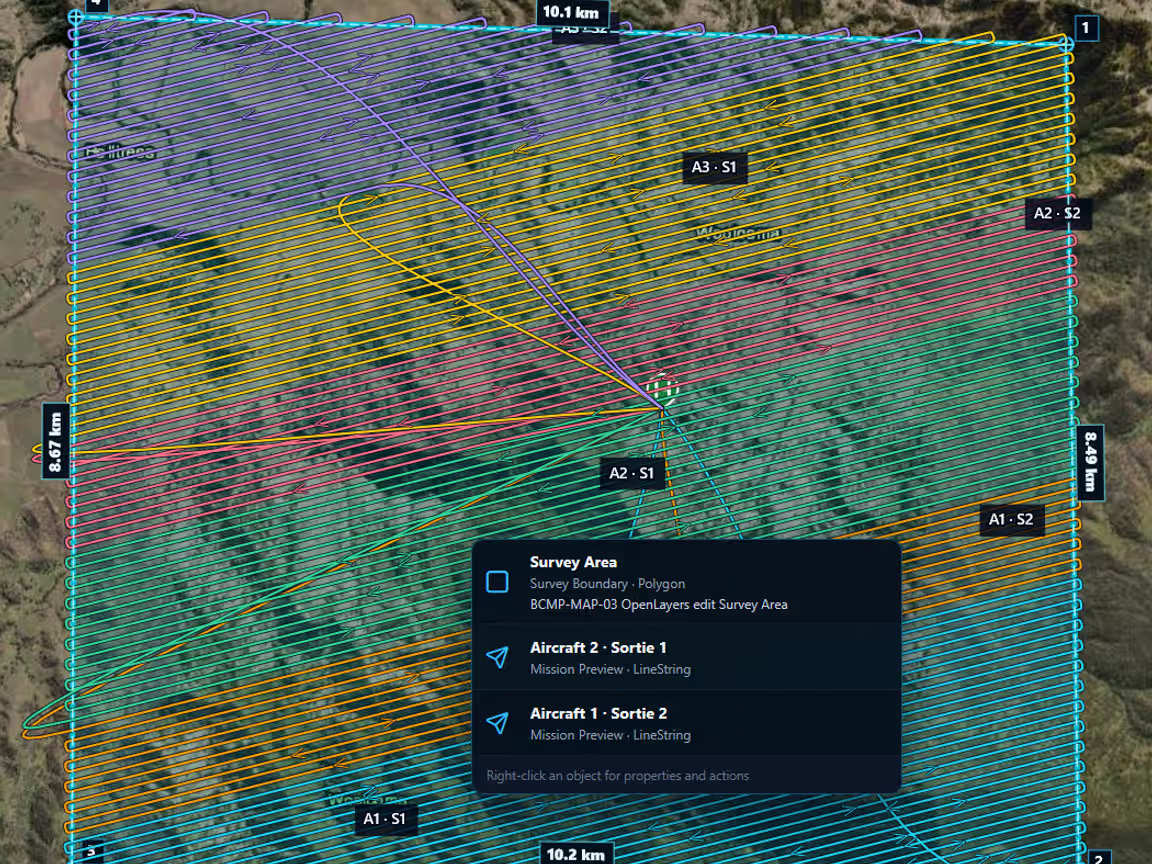
Start with your survey area and the data you need. We’ll help define the scope, review terrain-aware 2D and 3D flight plans, and keep field progress, processed data and deliverables together in the BlueCap Survey Portal.
No software subscription fee for BlueCap service projects.