BlueCap Australia
Geological & regolith mapping: separate the questions
Build a practical picture of surface materials, landforms and possible geological patterns beneath cover.
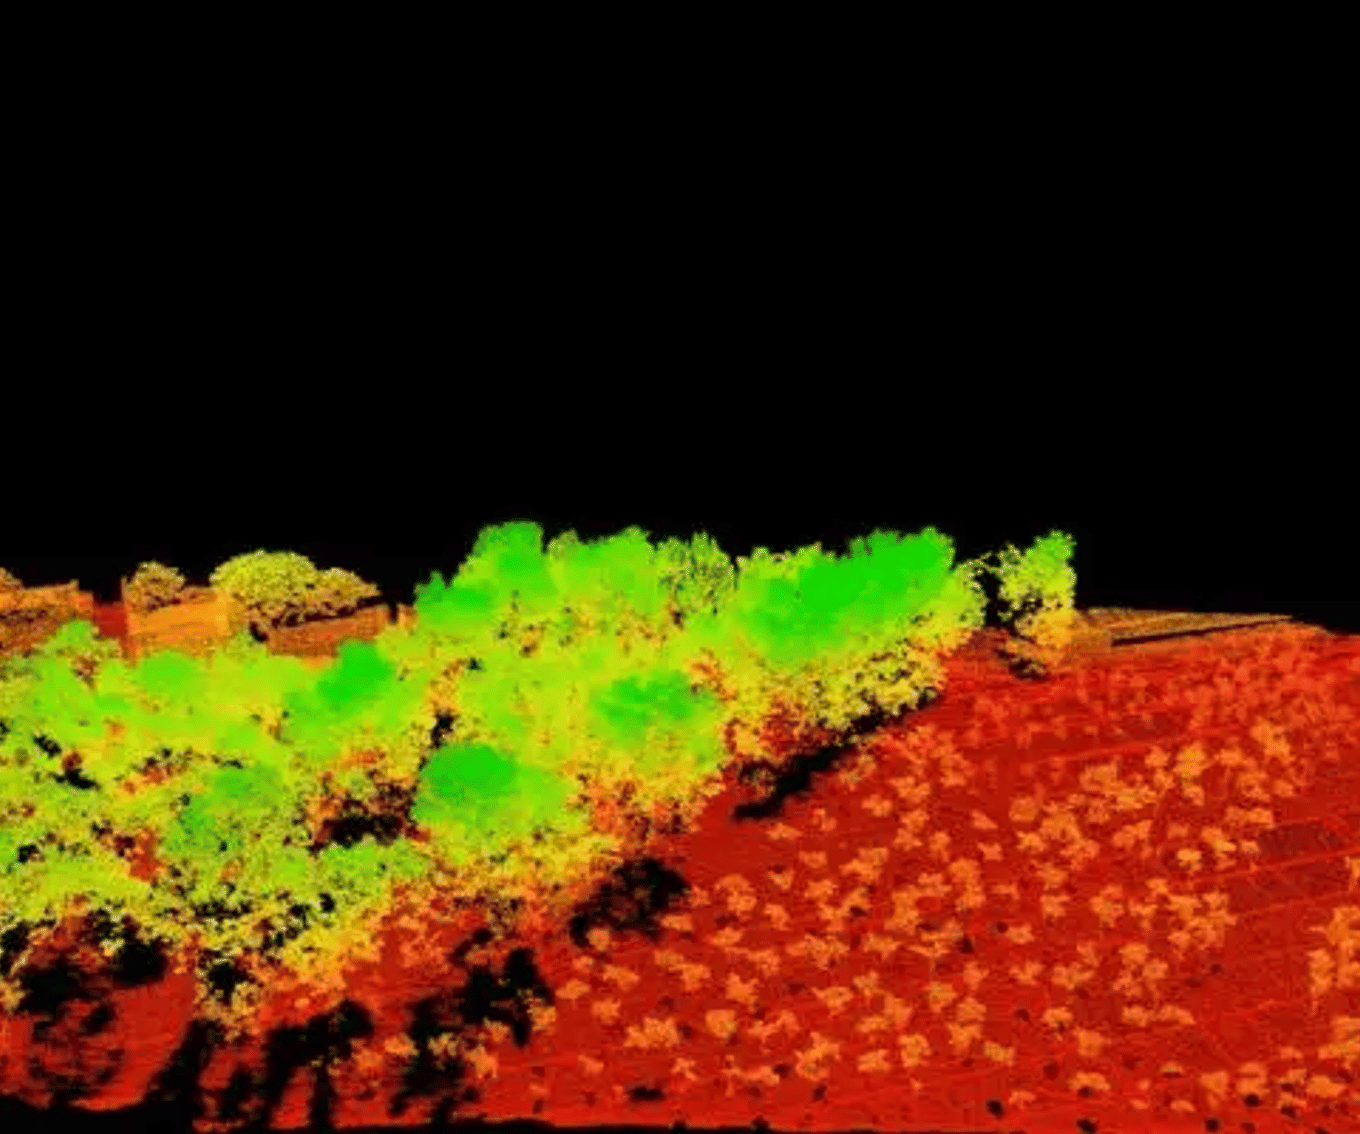
Geological and regolith mapping builds a practical picture of exposed material, weathered or transported cover, landform and possible geological patterns beneath cover. “What is the regolith?” and “where might a fault be?” are different questions and often need different evidence.
Read material, structure and landform separately
Turn several surface clues into a field-testable map.
Useful outputs to discuss
- Terrain, magnetic and gamma products with acquisition and processing context
- Interpreted domains with confidence notes and field-validation locations
- GIS-ready layers for mapping and sampling teams
Separate the question
Decide whether the next map needs to distinguish cover, structure, landform or a combination.
Layer the context
Compare terrain, near-surface gamma patterns and magnetic contrast without treating any one as a final answer.
Validate on the ground
Test boundaries and interpretations with mapping, samples, drill information and local knowledge.
What is regolith mapping?
Regolith is weathered, transported or unconsolidated material between fresh bedrock and the atmosphere. It can include soil, laterite, saprolite, alluvium, colluvium and dune sand. Its distribution records landscape processes but does not remove the need for field observations, samples, drill information and local geological knowledge.
Choose the observation that fits
Magnetics can help trace broad patterns, magnetic rock units and structural hypotheses where there is sufficient contrast in magnetic properties. It does not uniquely identify rock type, fault movement, depth, mineralisation or regolith type. Geoscience Australia provides the method context.
Radiometrics are a near-surface response. In a Cape York study, Wilford, Pain and Dohrenwend integrated airborne gamma data with Landsat imagery to help distinguish regolith types. The conventional airborne survey used 400 metre lines across thick vegetation and deeply weathered sandy soils: a useful case, not a UAV benchmark or universal classification result. Read the 1992 paper.
LiDAR terrain can provide landform and drainage context. Hillshade, slope and topographic-position derivatives can help frame field mapping and regolith interpretation, but terrain shape does not identify material composition. Geoscience Australia's multi-scale topographic-position product describes this geomorphic use.
A practical combined approach
- Use terrain to identify landforms, drainage and likely erosion or deposition settings.
- Use radiometrics to map changes in near-surface potassium, uranium and thorium responses.
- Use magnetics to develop a broader structural or lithological hypothesis.
- Test the interpretation with field mapping, samples, drill data and local records.
For example, terrain may show a palaeodrainage setting, gamma responses may differ from surrounding bedrock-derived material, and magnetic patterns may continue beneath the valley. Together these observations can improve a regolith interpretation; they still do not prove material type, depth to bedrock or structural history without site-specific evidence.
Typical deliverables
- interpreted regolith and geological-domain maps;
- magnetic, radiometric and terrain products with metadata;
- a record that separates observed evidence from inferred boundaries;
- field-validation locations and confidence notes; and
- GIS-ready layers and a short technical memorandum where scope and licensing permit.
Important limits
Magnetic anomalies are non-unique, surface gamma data are shallow and can be affected by ground and acquisition conditions, and LiDAR describes terrain rather than subsurface material. Public datasets can have dates, line spacings and processing standards unsuitable for a site decision. Always use the source survey report and metadata alongside maps or grids.
Specialist note: geothermal context
Gamma spectrometry has a limited specialist role in geothermal investigation because potassium, uranium and thorium contribute to radiogenic heat production. Carefully calibrated measurements of representative rock can help assess that one property. It is not a reservoir locator: surface gamma cannot establish deep temperature, permeability, fluid, reservoir extent or recoverable heat. McCay and co-authors review the technique and its limits.
Briefing checklist
- the decision the map must support and target scale;
- site boundary, access and coordinate system;
- existing geology, sampling, drill, geochemistry and geophysics;
- known cover, vegetation, terrain and land-use constraints;
- priority on regolith, structure, terrain/drainage or a combination;
- field-validation access, outputs, confidence reporting and licensing; and
- heritage, environmental, aviation and land-access requirements.
References and next reading
- Wilford, J. R., Pain, C. F. & Dohrenwend, J. C. (1992), “Enhancement and integration of airborne gamma-ray spectrometric and Landsat imagery for regolith mapping — Cape York Peninsula”, Exploration Geophysics 23, 441–445. DOI: 10.1071/EG992441. Cape York case; conventional 400 metre airborne lines.
- McCay, A. T. et al. (2014), “Gamma-ray spectrometry in geothermal exploration: state of the art techniques”, Energies 7, 4757–4780. DOI: 10.3390/en7084757. Review; not a reservoir-detection study.
- Geoscience Australia: radiometrics
Return to Choose a survey, compare magnetic, LiDAR and radiometric method information, see the drone surveys BlueCap flies across Australia, or discuss a project question.
Project enquiry
Let’s plan your survey
Start with your survey area and the data you need. We’ll help define the scope, review terrain-aware 2D and 3D flight plans, and keep field progress, processed data and deliverables together in the BlueCap Survey Portal.
No software subscription fee for BlueCap service projects.