BlueCap Australia
Mineral exploration: build the geological picture
Use an exploration survey to reduce geological uncertainty and decide what deserves field checking next.

Early exploration is about reducing uncertainty: understanding geology, mapping structures and cover, and identifying places that deserve field checking. A survey can help build that picture, but it does not prove that ore is present.
A practical starting point
Build the geological picture before committing to follow-up.
Useful outputs to discuss
- Magnetic, terrain or radiometric layers with their source metadata
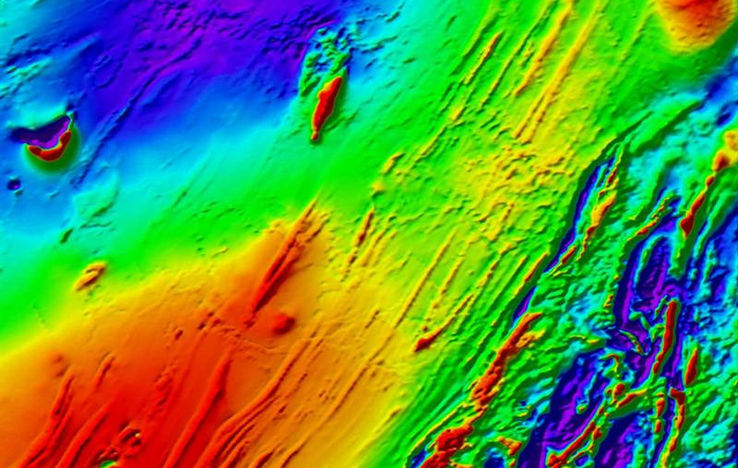
- An interpretation map that separates observed patterns from target hypotheses
- Prioritised places for mapping, sampling or specialist follow-up
Frame the model
Bring the commodity, deposit model, existing mapping and drill evidence into the brief.
Match the observation
Select magnetics, terrain or surface gamma context only where it can test part of that model.
Ground-check the lead
Use the map to plan fieldwork, sampling or the next specialist investigation.
Start with the geological question
Useful questions include where faults, contacts, dykes or intrusive bodies may continue beneath cover; whether a magnetic pattern supports the existing geological model; where surface materials change; and which areas should be prioritised for mapping, sampling or later specialist geophysics. Start with the target concept, existing geology, drillholes, tenure and access constraints.
When magnetics is the primary method
Magnetic surveys measure variations in the Earth's magnetic field caused by contrasts in magnetic minerals. They can help map geological patterns and boundaries where units have enough magnetic contrast. That makes magnetics a sensible starting observation for tracing possible structures, contacts or magnetic units, or for improving a prospect-scale structural framework. Geoscience Australia explains the measurement and its geological uses.
Magnetic data are indirect. A strong anomaly can arise from magnetite-bearing rock, remanence, cultural interference or another non-economic source. A weak anomaly does not rule out mineralisation. Interpretation needs geological context, available petrophysics, terrain, field observations and knowledge of the survey design.
Where radiometrics and terrain help
Gamma-ray spectrometry estimates near-surface potassium, equivalent uranium and equivalent thorium from natural gamma radiation. The uranium and thorium values are equivalent estimates inferred from the spectrum, not direct assays. The method can add geological and regolith context where a question concerns exposed rock, soils, drainage or weathering patterns. It is not a way to see through deep cover: Geoscience Australia describes the method as primarily geological mapping and notes the shallow nature of the response. Read the official radiometrics overview.
LiDAR-derived terrain can make drainage, scarps, slopes and candidate lineaments easier to review and can help plan access and field traverses. It describes the land surface, not mineralisation or subsurface geology.
A practical combined-method example
At Qullissat on Disko Island, Greenland, Jackisch and co-authors combined drone magnetic data and topography with surface mineralogical observations, ground measurements, drill-core information and petrophysics. Their constrained magnetic modelling helped interpret a partly exposed mineralised magmatic unit and prioritise outcrops for sampling. Read the open-access 2022 study in Solid Earth.
It is an illustration of integrated evidence, not a template for every Australian prospect. The study covered a rugged, partly exposed approximately 6 by 3 kilometre Greenland area and used legacy core plus ground, laboratory and multispectral inputs. It does not establish a general detection depth, accuracy, discovery outcome or economic result, and it does not imply a multispectral offering.
Typical exploration-ready deliverables
- processed magnetic, radiometric or terrain products with source metadata;
- map layers that distinguish observations from interpreted trends or target areas;
- a clear processing and display record;
- a concise limitations statement and coverage gaps; and
- prioritised areas for field checks, mapping, sampling or specialist follow-up.
What a survey cannot tell you
A remote, airborne or surface geophysical survey cannot by itself establish ore, grade, tonnage, continuity, economic viability, a compliant Mineral Resource or Ore Reserve, or a drilling result. A gridded map also interpolates between observations, so apparent continuity is not direct measurement everywhere. Use the result to make the next decision better informed.
Briefing checklist
- commodity and deposit model under consideration;
- exact decision the work should inform;
- area, coordinate system, tenure and access information;
- existing geology, drillholes, assays, geochemistry and geophysics;
- known workings, infrastructure and likely magnetic interference;
- cover, vegetation and terrain conditions;
- desired formats, users and follow-up pathway; and
- land access, heritage, environmental and aviation constraints.
References and next reading
- Jackisch, R. et al. (2022), “Drone-based magnetic and multispectral surveys to develop a 3D model for mineral exploration at Qullissat, Disko Island, Greenland”, Solid Earth 13, 793–825. DOI: 10.5194/se-13-793-2022. Case-specific Greenland study; not a BlueCap performance claim.
- Geoscience Australia: using geophysics for mineral exploration
- Geoscience Australia: magnetics and radiometrics
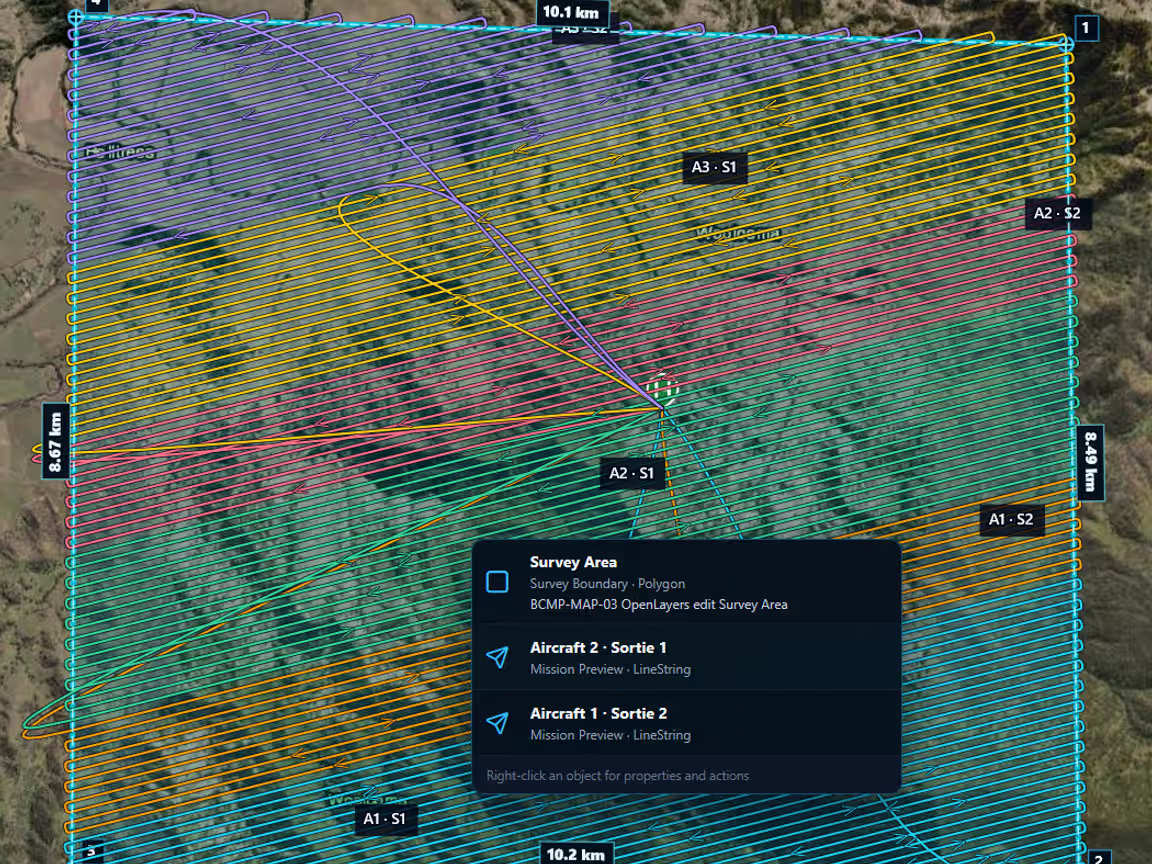
Return to Choose a survey, compare the detailed magnetic, LiDAR and radiometric method pages, see how BlueCap delivers drone surveys for mineral exploration, or discuss a project boundary and question.
Project enquiry
Let’s plan your survey
Start with your survey area and the data you need. We’ll help define the scope, review terrain-aware 2D and 3D flight plans, and keep field progress, processed data and deliverables together in the BlueCap Survey Portal.
No software subscription fee for BlueCap service projects.